Elimination Table and Docs colourful chart | Page 3 | PASOTI
  • This site is sponsored by Lang & Potter.

Elimination Table and Docs colourful chart

Sep 6, 2006
16,799
4,441
signalspast":1pykbs9t said:
If only we had picked up draws in our bad run we would have been top. Yeah i know the word if.

The point IS that run is in complete contrast to the rest of the season which is play off form. Even with relegation form .5 point a game in that run we would be in a good position now.
 
Aug 17, 2005
2,390
608
Balham_Green":3qjqbu86 said:
signalspast":3qjqbu86 said:
If only we had picked up draws in our bad run we would have been top. Yeah i know the word if.

The point IS that run is in complete contrast to the rest of the season which is play off form. Even with relegation form .5 point a game in that run we would be in a good position now.

Well well well something I actually agree with u on.
 
Sep 25, 2010
3,280
558
Sorry Doctor, I do prefer Ottawa’s version. No offence

It Is just simpler, and easier to read, not complicated

Although yours is extremely interesting.
 
Feb 13, 2021
129
210
I find both charts fascinating...and will enjoy watching them change over the weeks to come.

Thank you

:scarf:
 

Keith Hennessey

🇳🇿🇳🇿🇳🇿🇳🇿🇳🇿🇳🇿
Jul 17, 2006
2,497
467
73
Blenheim New Zealand.
GreenThing":1il74hy3 said:
The Doctor":1il74hy3 said:
Here you go...

Number next to team name is goal difference ('==' means same as Argyle, '++' means better than Argyle. Length of solid colour bar corresponds to points, length of paler colour bar is available points (so total length of coloured bar is max points for that team). Number on pale coloured bar is goal difference relative to Argyle.

league1_0218-1.jpg

Thanks Doc, this version is so much easier to read than the hashtag thingy, especially when viewing on my phone.


Hey Doc , Loving the discreet way that you have spelled ARG YLE ala the Mayflower seats , which really irks a lot of people especially me.. :oops:
 
Jun 27, 2019
6,690
7,406
Balham_Green":39unk97i said:
Ottawa Green":39unk97i said:
mutley marvel":39unk97i said:
Well i am a lady of a certain age & i am totally confused- can you do the table in plain english or say this is where we will finish if we carry on as we are : :?


Lady the current League table is at the bottom of each page.

The lady would like to know where we finish if we carry on as we are which is a very good question. Anybody got the patience and skills to input current form in to the equation?. That would be more interesting. Such a shame we had that 6 game run where we lost the plot. Just 2 or 3 points would make a big difference.

I've just had a quick go at this.
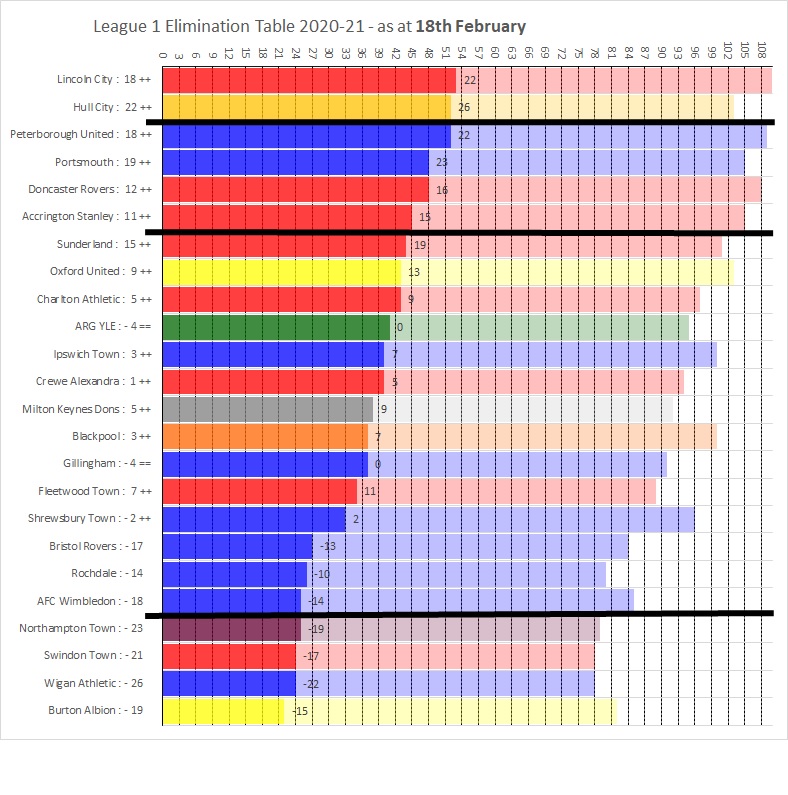
PPG Last 8

Based on points per game over the past eight matches we would finish sixth. Peterborough would win the league and Oxford would finish second, while Lincoln, Doncaster and Hull would join us in the playoffs. Portsmouth would miss out by a point.

Rochdale, Wigan, Wimbledon and Northampton would go down. Burton (who are currently bottom) would survive, as would Swindon - who were awful when we played them and lost their best players in January.
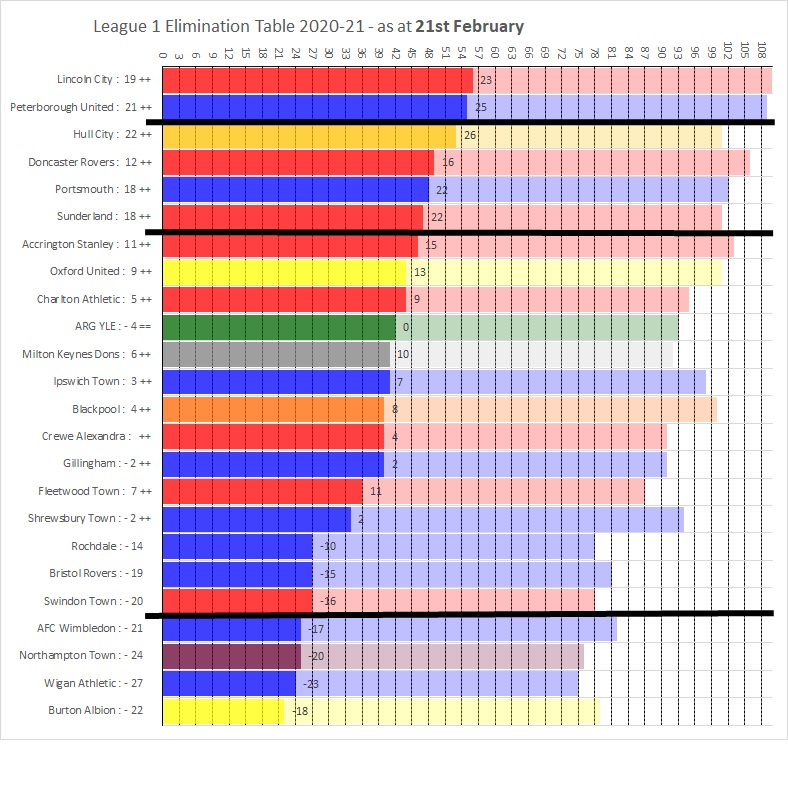
PPG Entire Season

Based on points per game over the season as a whole we would finish 13th and miss out on the playoffs by miles - more than 12 points. Gaining an extra point or two in the six-match losing run wouldn't have been enough - we'd have needed something like two wins and two draws out of that run to have made the playoffs.

Lincoln and Peterborough would finish in the top two with Doncaster, Hull, Portsmouth and Accrington in the playoffs. Northampton, Swindon, Wigan and Burton (the current bottom four) go down.

Essentially we need to continue automatic promotion form to make the playoffs.
 

Keith Whitfield

✨Pasoti Donor✨
Mar 30, 2015
313
611
Following on from last year's end of proceedings, I have occasionally calculated points per game to try and show a sort of level playing field at a point (put not intended) in time. One based on the last six, eight or nine games would be a useful development of that. Not downplaying the value of the elimination table or Doc's thingy, but a useful addition might be a recent form points-per-game table.
 
Jul 29, 2012
431
228
In the first 11 games we had 19 points and from the 11 games after the 6 consecutive defeats we have won 22 points .

So ignoring the 6 consecutive games , 41 points from 22 games , which is close to automatic promotion form . Taking that form over the next 18 games results in a final total of 75 points . In an average year 75 points scrapes into the last playoff place .
 

The Doctor

🏆 Callum Wright 23/24
✨Pasoti Donor✨
Sep 15, 2003
8,947
4,453
Plymouth
andapoet.blog
Martyn":kfxghnon said:
Sorry Doctor, I do prefer Ottawa’s version. No offence

It Is just simpler, and easier to read, not complicated

Although yours is extremely interesting.

That's fine - it's not compulsory to like one or other or both of these formats! OG's is more text/number based and mine is more visual - different people often get more out of looking at things in one way or another. Just enjoy looking at whatever you want to look at!
 

The Doctor

🏆 Callum Wright 23/24
✨Pasoti Donor✨
Sep 15, 2003
8,947
4,453
Plymouth
andapoet.blog
WoodsyGreen":2toq7bmz said:
Based on points per game over the past eight matches we would finish sixth. Peterborough would win the league and Oxford would finish second, while Lincoln, Doncaster and Hull would join us in the playoffs. Portsmouth would miss out by a point.

:funny:
 

Ottawa Green

Site Admin
Staff member
🇨🇦🇨🇦🇨🇦🇨🇦🇨🇦🇨🇦
🏆 Callum Wright 23/24
Cream First
✅ Evergreen
✨Pasoti Donor✨
Sep 18, 2003
24,121
2,272
72
Ottawa, Canada
Updated Feb 20.

Code:
Pos    Team              P         GD        Pts    Max   Highest  lowest

1    Lincoln            28         19        56     110     1       24  
2    Peterborough       28         21        55     109     1       24


------------------------------------------------------------------------------
3    Hull City          30         22        53     101     1       24
4    Doncaster          27         12        49     106     1       24
5    Portsmouth         28         18        48     102     1       24
6    Sunderland         28         18        47     101     1       24

------------------------------------------------------------------------------
7    Accrington         27         11        46     103     1       24
8    Oxford             27          9        44     101     1       24
9    Charlton           29          5        44      95     1       24
10   P. Argyle          29         -4        42      93     1       24
11   M.K. Dons          29          6        41      92     1       24
12   Ipswich            27          3        41      98     1       24
13   Blackpool          26          4        40     100     1       24
14   Crewe              29          0        40      91     1       24
15   Gillingham         29         -2        40      91     1       24
16   Fleetwood          29          7        36      87     1       24
17   Shrewsbury         26         -2        34      94     1       24
18   Rochdale           29        -14        27      78     1       24
19   Bristol R..        28        -19        27      81     1       24
20   Swindon            29        -20        27      78     1       24

---------------------------------------------------------------------------
21   Wimbledon          27        -21        25      82     1       24
22   Northampton        29        -24        25      76     1       24
23   Wigan              29        -27        24      75     1       24
24   Burton             27        -22        22      79     1       24

_____________________________________________________
Code:
Pos    Team              P         GD           Max   Highest  lowest

1    Lincoln            27         18            110     1       24  
2    Peterborough       27         18            109     1       24
------------------------------------------------------------------------------
3    Doncaster          26         12            106     1       24
4    Accrington         25         11            103     1       24
5    Portsmouth         27         19            102     1       24
6    Hull City          29         22            101     1       24
------------------------------------------------------------------------------
7    Oxford             26          9            101     1       24
8    Sunderland         27         15            101     1       24
9    Blackpool          25          3            100     1       24
10   Ipswich            26          3             98     1       24
11   Charlton           28          5             95     1       24
12   Shrewsbury         25         -2             94     1       24
13   P. Argyle          28         -4             93     1       24
14   M.K. Dons          28          5             92     1       24
15   Crewe              28          1             91     1       24
16   Gillingham         28         -4             91     1       24
17   Fleetwood          28          7             87     1       24
18   Wimbledon          26        -18             82     1       24
19   Bristol R..        27        -18             81     1       24
20   Burton             26        -19             79     1       24
---------------------------------------------------------------------------
21   Rochdale           28        -14             78     1       24
22   Swindon            28        -21             78     1       24
23   Northampton        28        -23             76     1       24
24   Wigan              28        -26             75     1       24
 

Keepitgreen

🏆 Callum Wright 23/24
🇰🇪 Welicar Donor
♣️ PACSA Member
♣️ Senior Greens
✅ Evergreen
Jade Berrow 23/24
🎫 S.T. Donor 🎫
🚑 Steve Hooper
✨Pasoti Donor✨
🌟Sparksy Mural🌟
May 12, 2008
12,498
1,574
Plymouth
It's a bit on the small side Doc, can you post it the same size as the one on page 2? Ta.